
Mastering Market Structure Analysis for Better Trading Decisions
Share
Market structure analysis is a cornerstone of successful trading, offering traders insights into the underlying dynamics of price movement. By understanding market structure, traders can identify key levels, anticipate potential price action, and make more informed decisions. In this article, we'll explore the fundamentals of market structure, how it can enhance your trading strategy, and which tools can help you apply these concepts effectively.
What is Market Structure?
Market structure refers to the organization of price action over time. It encompasses patterns, trends, ranges, and other formations that traders use to predict future price movements. Unlike technical indicators that rely on mathematical calculations, market structure analysis focuses on the raw price data, providing a more straightforward yet powerful approach to understanding market behavior.
Key Concepts in Market Structure
There are several key concepts that form the basis of market structure analysis:
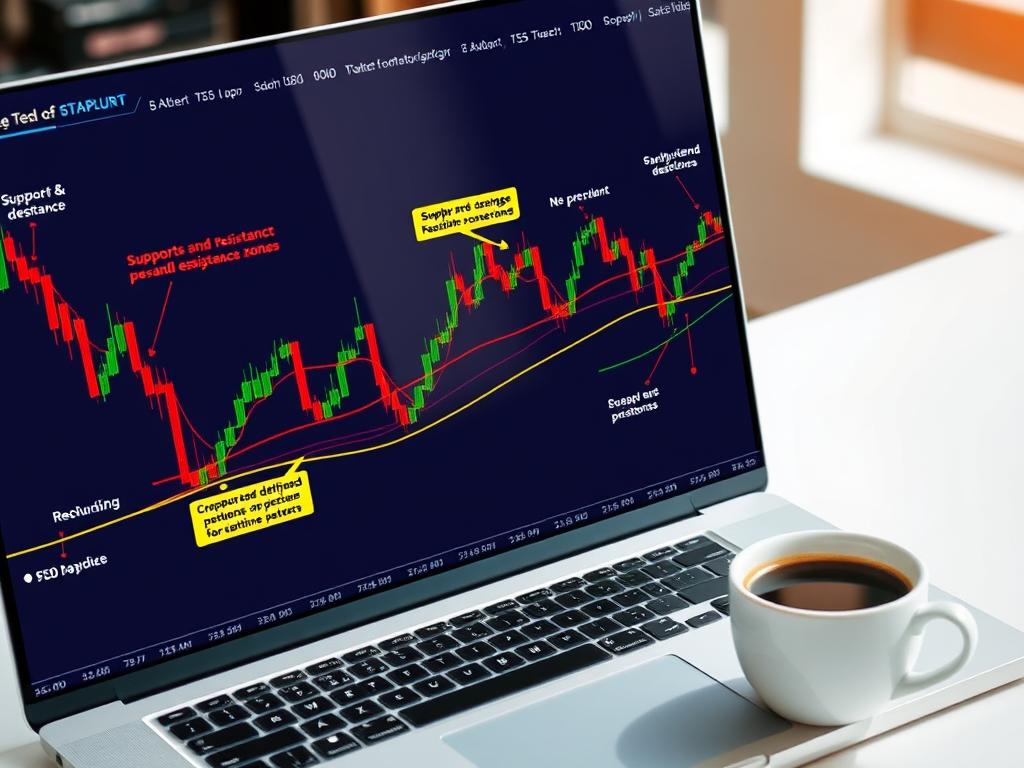
- Support and Resistance Levels: These are areas where price has historically bounced or broken down, indicating potential stopping points for buyers or sellers.
- Supply and Demand Zones: These are regions where significant buying or selling interest is concentrated, often leading to price reactions.
- Trend and Range Markets: Markets can either be trending (showing a clear direction) or ranging (moving within a defined area). Understanding the current market state is crucial for strategy selection.
- Continuation and Reversal Patterns: These patterns signal whether the current market trend is likely to continue or reverse, helping traders anticipate changes in momentum.
How to Apply Market Structure in Your Trading
Integrating market structure analysis into your trading routine can be done through a few simple yet effective steps:
- Identify Key Levels: Start by marking out support and resistance levels, as well as supply and demand zones, on your charts. These levels can serve as targets or areas to watch for potential price reactions.
- Analyze Market Phases: Determine whether the market is in a trending or ranging phase. This will influence the types of strategies you employ, as trend strategies differ from range strategies.
- Look for Pattern Confirmation: Use price action patterns to confirm potential market movements. For example, a bullish engulfing candlestick pattern at a support level could indicate a potential upward move.
- Combine with Other Tools: Market structure analysis works best when combined with other tools, such as Wick Test Indicator or Range Deviations Indicator, to refine your entry and exit points.
Tools to Enhance Your Market Structure Analysis
While market structure analysis can be performed with basic charting tools, there are several specialized indicators that can enhance your analysis and save you time:
- Wick Test Indicator: This tool helps identify market sentiment by analyzing the upper and lower wicks of candles, which can indicate rejection or acceptance at certain price levels.
- Range Deviations Indicator: This indicator highlights deviations from the average range, helping you spot potential breakouts or reversals.
- Pace of Tape Indicator: This tool measures the speed and momentum of price action, useful for identifying impulses that are common in trending markets.
Practical Tips for Implementing Market Structure Analysis
Like any trading approach, mastering market structure analysis takes practice. Here are a few tips to help you get started:
- Start with Higher Time Frames: Analyze higher time frames (e.g., daily or weekly charts) to get a broader view of market structure before zooming in on lower time frames for execution.
- Keep It Simple: Avoid cluttering your charts with too many levels or indicators. Focus on the most significant support and resistance areas and the primary market phase.
- Backtest Your Approach: Test your market structure analysis on historical data to see how it performs in different market conditions.
Conclusion
Market structure analysis is a powerful yet underutilized tool in the trader's arsenal. By focusing on the raw price action, traders can gain valuable insights into market dynamics and make more informed decisions. Combined with the right indicators and a structured approach, market structure analysis can help you anticipate market movements, identify key levels, and refine your trading strategy. Start incorporating these concepts into your trading routine today and see the difference it can make in your performance.
Explore our range of tools designed to support your market structure analysis, such as the Wick Test Indicator and Range Deviations Indicator, and elevate your trading to the next level.