Quantower Edge
Range Deviations Indicator
Range Deviations Indicator
Couldn't load pickup availability
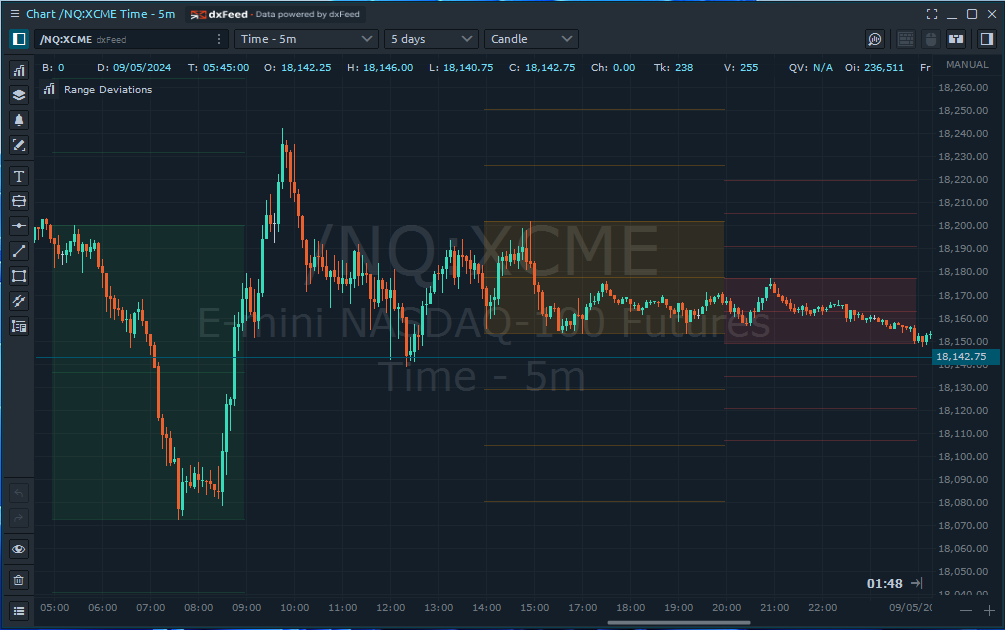
The Range Deviations Indicator is an advanced trading tool tailored for traders who focus on precision and detail in their market analysis. This indicator dynamically calculates and visualizes the price ranges and standard deviations of user-defined trading sessions, offering a robust means to analyze market behavior during specific time windows.
Key Features:
-
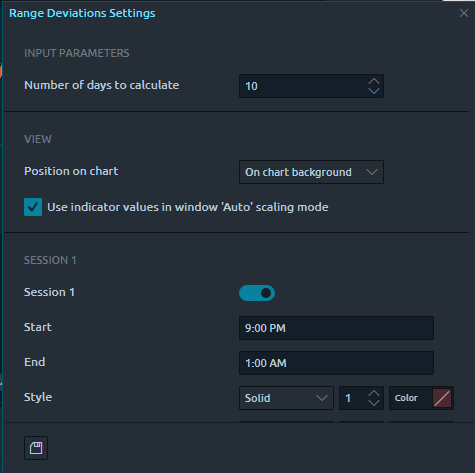
Multiple Sessions Analysis: Configure up to five distinct trading sessions, each with customizable start and end times, enabling traders to focus on specific periods of market activity.
-
Visual Customization: Each session can be visually differentiated with options for color, line style, and transparency, allowing for a clear and distinct representation of each session on the chart.
-
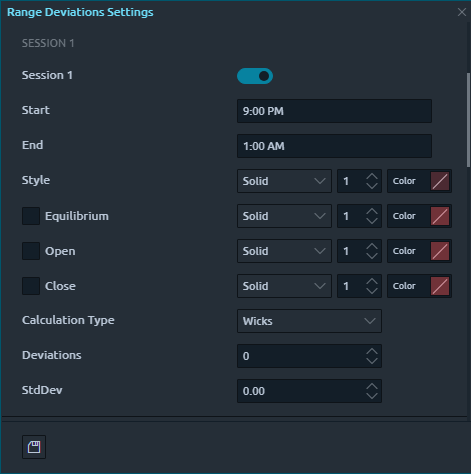
Advanced Range Calculations: Offers the choice to calculate high and low ranges based on either the wicks or bodies of candlesticks, providing flexibility in how market volatility and range are assessed.
-
Standard Deviation Layers: Includes the ability to add multiple standard deviation lines around the session's range, aiding in volatility analysis and potential breakout or rebound zones.
-
Equilibrium, Open & Close Lines: Each session can display a median, Open & Close line, providing a quick visual reference for the of the session's price range.
Benefits:
-
Enhanced Market Insight: By examining specific periods of trading activity, traders can gain insights into market sentiment and price stability or volatility during these times.
-
Customized Strategy Development: Enables traders to develop strategies that are fine-tuned to specific market conditions observed during chosen trading sessions.
-
Improved Decision Making: Visual cues and statistical data points such as standard deviations help traders make more informed decisions about entry and exit points.
-
Versatility: Suitable for a wide range of financial instruments and markets, including forex, stocks, commodities, and indices.
The Range Deviations Indicator is perfect for traders looking for a deeper understanding of market dynamics during specific trading hours. Its customizable features and detailed analytics provide a comprehensive toolset for strategic trading based on precise market behavior analysis. Whether used for intraday trading or to assess price movements in broader time frames, this indicator offers valuable insights to enhance any trading methodology.
Changelog
12 September 2024
- Introduced an override to limit the number of days to calculate in settings
- Extended Equilibrium line to include line styling
- Added Open and Close line options
- Refactored data loading to optimize user experience and prevent application hang
- Improvements to visual setting changes
28 June 2024
- Initial release
Share
