Quantower Edge
Higher Timeframe Candles Indicator
Higher Timeframe Candles Indicator
Couldn't load pickup availability
Introducing the "HTF Candles" Indicator for Quantower®: A Revolutionary Way to Visualize Market Movements
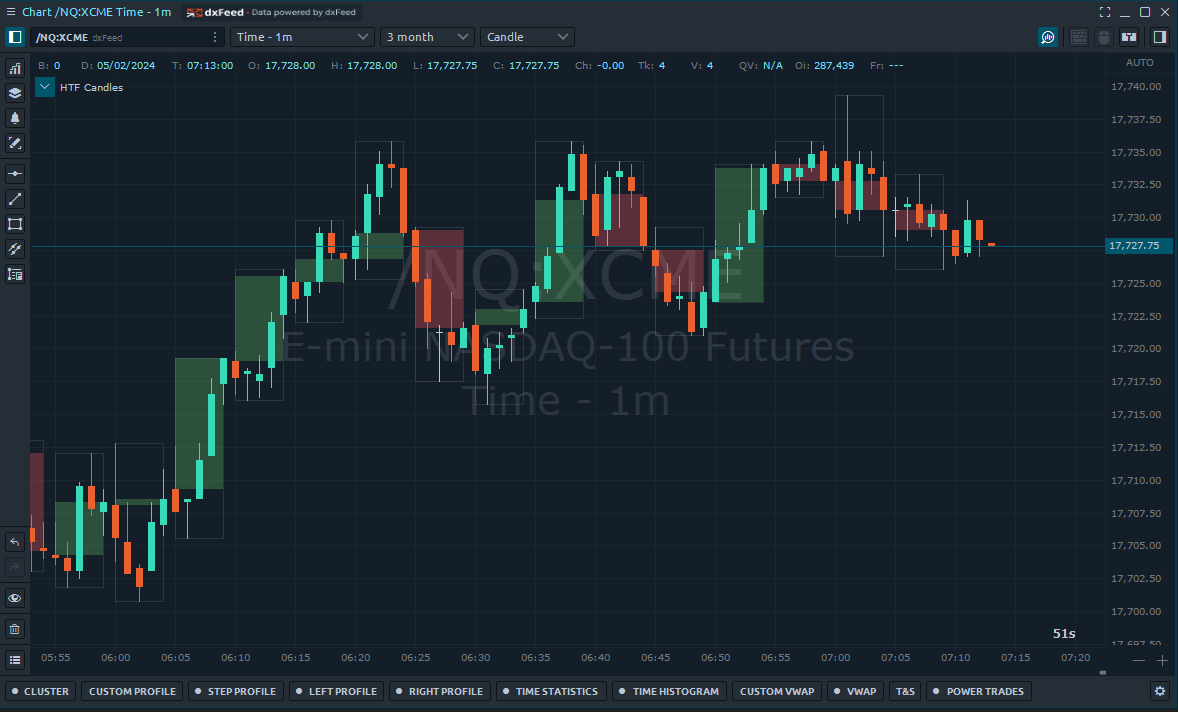
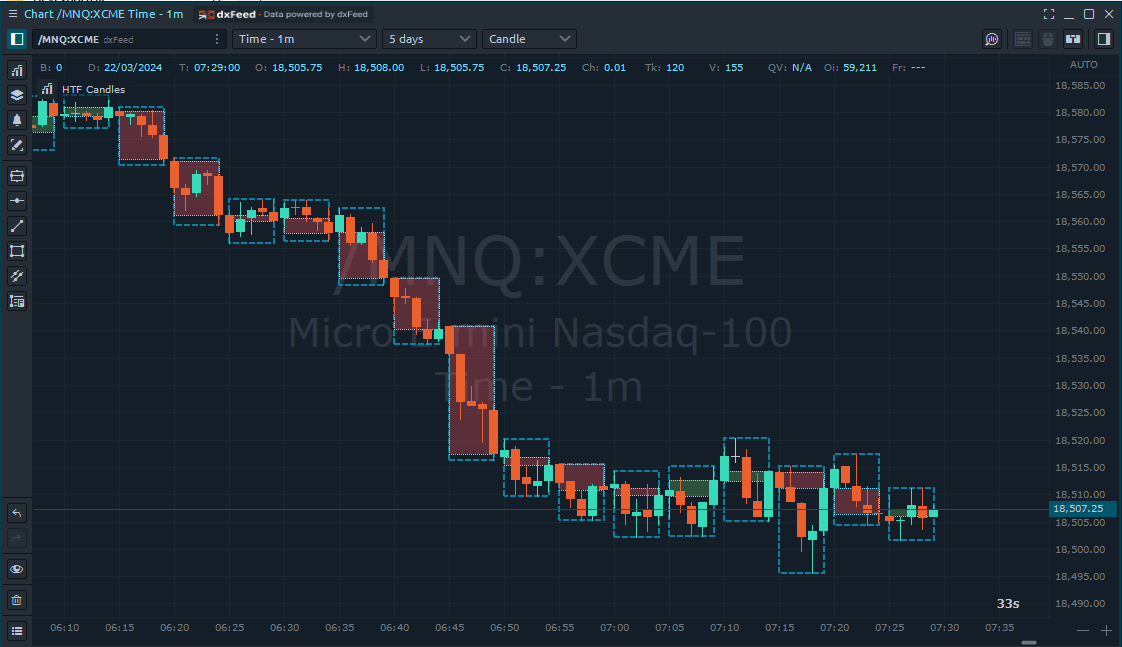
The HTF Candles Indicator is a cutting-edge trading tool designed for the Quantower® platform, offering traders the unique ability to visualize higher timeframe candles directly on lower timeframe charts. This innovative indicator seamlessly blends the comprehensive overview of higher timeframe analysis with the detailed, moment-to-moment insights provided by lower timeframe charts, enabling traders to make more informed decisions based on a fuller understanding of market trends.
Key Features:
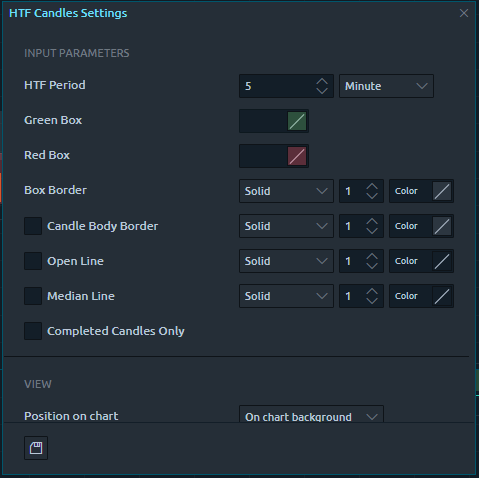
- Higher Timeframe Visualization: With the HTF Candles Indicator, traders can select a higher timeframe (HTF) from a range of periods, such as 5 minutes, to overlay onto their current trading chart. This feature allows for an immediate grasp of the broader market trends without the need to switch between different chart views.
- Customizable Appearance: The indicator comes with customizable options for the appearance of the HTF candles, including distinct colors for bullish (green) and bearish (red) boxes, as well as adjustable settings for box borders. This customization ensures that the visual representation of market movements is clear, intuitive, and aligned with the trader's preferences.
- Dynamic Line Options: Traders have the option to enable additional lines on the chart, such as Open Lines and Median Lines, with customizable colors, styles, and widths. These lines provide extra analytical depth, highlighting significant price levels and market medians on the higher timeframe directly within the lower timeframe chart.
- Efficiency and Precision: The HTF Candles Indicator is designed for efficiency, including an option to display only completed candles, ensuring that the information presented is both accurate and timely. This feature is particularly useful for traders focusing on end-of-period price confirmations and trend stability.
Technical Details:
- The indicator dynamically fetches historical data corresponding to the selected higher timeframe and recalculates the visualization as new data becomes available. This ensures that the overlay is always up-to-date, reflecting the latest market conditions.
- Utilizes partial transparency in the coloring of the HTF candles, allowing for an overlay that enhances rather than obscures the underlying lower timeframe chart. This thoughtful design choice ensures that traders can simultaneously benefit from the detailed granularity of short-term price movements and the strategic overview provided by HTF analysis.
- Incorporates advanced graphical rendering techniques to draw HTF candles with precision, including the representation of open, high, low, close, and median values in a visually intuitive format. This level of detail supports advanced technical analysis and decision-making processes.
The HTF Candles Indicator is an indispensable tool for traders who wish to leverage the insights of higher timeframe analysis while actively trading on lower timeframes. Its integration into the Quantower® platform reflects a commitment to providing traders with the most advanced and user-friendly analytical tools available. Whether you're a day trader seeking to contextualize your trading within broader market trends, or a swing trader looking for precision entry and exit points, the HTF Candles Indicator offers the clarity and depth needed to navigate the markets effectively.
Changelog
24 November 2025
- Feature: Addition of option to align indicator with Step Profiles
12 September 2024
- Bugfix: Internal method change with version 1.141.1
20 March 2024
- Migrate .NET7 to .NET8
5 February 2024
- Initial Release
Share


